Using gross figures of exports and imports to approach the contribution of trade to economic growth and a country’s resource allocation may be misleading. Products often cross borders more than once while being processed until their final use and may thus be counted multiple times. Furthermore, given the increased use of imported intermediate goods and services associated with rising global trade flows in the last decades, not only exports of goods and services carry some content of imported inputs classified in other sectors, but also some exports of intermediate products may return embedded in imported final products. Therefore, in order to gauge appropriately where and how much is the value added by a country’s employed labor and other factors of production, one has to do due accounting of those intra- and cross-sector trade in order to measure trade in value-added terms – see a thorough analysis in Mattoo et al (2013).
Such multiple counting and cross-sector trade of intermediate goods and services rose exponentially with the increasing cross-border “fragmentation of production systems” and the rising emergence of global or regional value chains. Fortunately, data on trade in value added have started to become available thanks to a joint OECD-WTO initiative: TiVA. As such databases are now developed, one is able to revisit many of the assessments heretofore made using gross values of exports and imports. And maybe find surprises…
Take the case of South-South trade. Back in March 2010, using gross trade figures, Mona Haddad, Gordon Hansen and I noted that much of the increase in developing countries’ exports in the period 1998-2008 had been driven by demand in other developing countries, with trade among these countries rising as a share of world trade. Given the then gloomy growth prospects for most advanced economies, we remarked how developing countries might continue to rely on South-South trade to recover from the crisis. In fact, countries like China were already leading the recovery through booming import demand.
Last month, the BBVA EAGLEs team released results of an analysis of South-South trade in the period 2000-2009, using the OECD-WTO database to offer a new perspective in value-added terms. Let me borrow here just three of their results, a sample enough to confirm how value-added glasses will often reveal a different picture from the one using gross trade values.
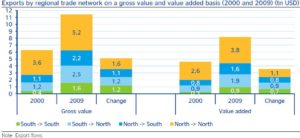
First, as it can be seen in Chart 1 below, taken from them, the rising weight of South-South trade in the 2000s – as seen by my co-authors and me – seems to have been overestimated. This stems from the fact that the domestic value added incorporated in foreign final demand is proportionately smaller in South-South trade as compared to South-North, North-South, and North-North.
Chart 1

 Source: BBVA EAGLEs (August 2013)
Second, the share of commodities and services is higher for South-South trade on a value added basis than in gross terms. While manufacturing reaches a 71% share of trade in the latter, it falls to 42% on a value added basis. This reflects to a large extent the North-South content embedded in Southern manufacturing exports.
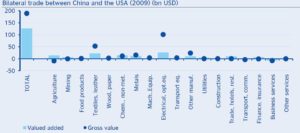
Third, bilateral trade relations among countries change dramatically in some cases once figures are adjusted to a value added basis. Just to mention one “hot” case: China’s trade surplus with the US is reduced by one third when due accounting in value added terms is made (Chart 2).
Chart 2

 Source: BBVA EAGLEs (August 2013)
It seems appropriate to say, like Maurer and Degain (2010) from WTO, that when it comes to globalization and trade flows, “what you see is not what you get!” Definitely we need to develop and incorporate analyses of trade in value added when it comes to approaching global imbalances, market access and trade disputes, cross-country macroeconomic shocks, trade and employment and many other themes developed in Mattoo et al (2013).
First appeared at Let’s Talk Development, Roubini EconoMonitor, and Huffington Post
